
Traditional farm block management assumes that all plants are exactly the same across the entire farm (i.e., spatial homogeneity). Spatial differences in plant vigor can lead to large differences in yield or fruit quality across a vineyard. Remote sensing tools make it possible to measure some of these plant differences so that the farmland can be divided into smaller management zones. Precision viticulture uses techniques and tools that help growers manage differences within the vineyard instead of treating the whole vineyard in the same way.
The Precision Viticulture Team consists of researchers from New York, Virginia, and California. The main goal of this project team is to improve fertilizer use efficiency. This can be achieved by reducing total fertilizer use without loss in vine health or fruit quality or by distributing the same amount of fertilizer but to only those plants that need it to improve uniformity in vine health and fruit quality. The research team is using data collected by the Sensor Development Team and plant nutrition recommendations determined by the Plant Nutrition Team. This combined data is used to form a farm map with management zones. Such maps can be used to determine optimal tissue sampling locations in the vineyard to confirm the nutrient status. The same maps can be uploaded to a fertilizer spreader and be used for variable rate fertilizer applications.
Research results
Nutrient mapping. Imaging scientists from Rochester Institute of Technology (RIT) took multispectral images of Concord vineyards across New York state at bloom and véraison over multiple years. Leaves were sampled from individual plants throughout these vineyards, analyzed for nutrient concentrations, and used to produce spatial nitrogen concentration maps using the processing platform developed by the Efficient Vineyard Project. The team is expanded the platform capabilities to include nutrient data.

Testing in-field sampling protocols for sensor validation. Prior to having the predicted N map (Figure 1), other available spatial data layers were used to generate in-field tissue sample locations. Soil apparent electrical conductivity (ECa), crop load (derived from spatial yield and pruning weight information), and bloom NDVI (normalized difference vegetation index) data layers were input layers into a cluster analysis to generate four management classifications. Within each management classification, three sampling locations were generated. These locations were used for gathering leaf samples at bloom and véraison for nutrient concentration analyses (Figure 2).

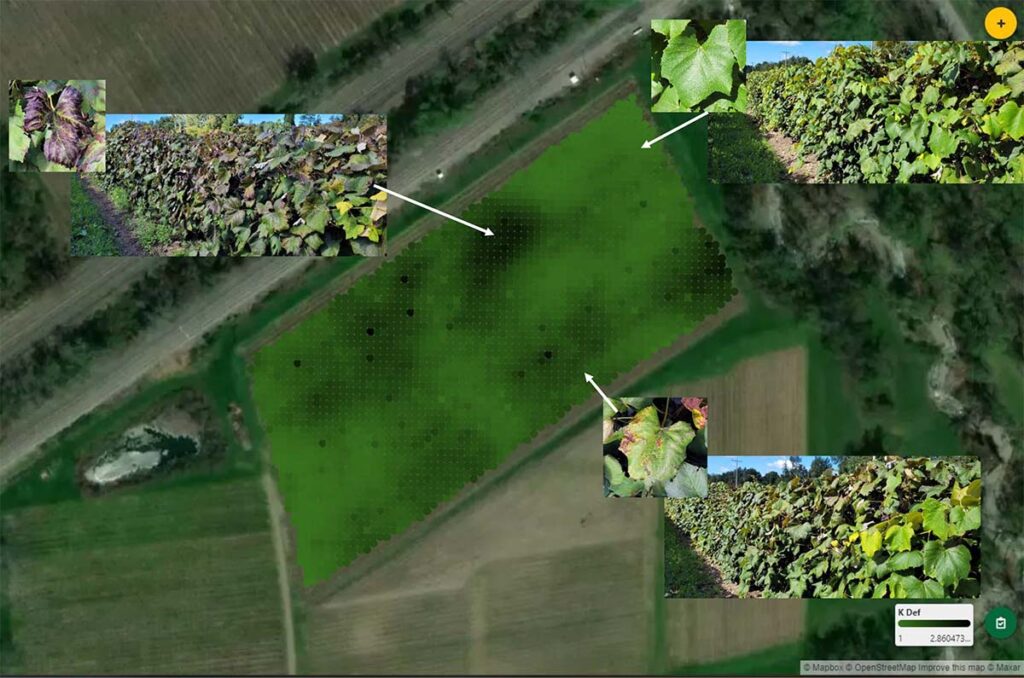
Continued development of MyEV software for commercial growers. The team uses the My Efficient Vineyard (MyEV) platform to organize and present data for grower decision-making. The MyEV accepts sensor data. As new sensors are developed, they are being added to the MyEV platform. The MyEV smartphone app allows for the collection of spatial data from vineyard worker observations. Between véraison and harvest, leaf potassium (K) deficiency was observed in Lake Erie Concord vineyards. A K deficiency severity map was generated using MyEV based on spatial smartphone images of K deficiency symptoms collected in the field. This user-friendly interface was further developed within this project.
Publications from the team
Team Members
Researchers (see details here)
- Terry Bates, Cornell
- Matthew Fidelibus, University of California – Davis
- Drew Harner, Virginia Tech
- Justine Vanden Heuvel, Cornell
Research Lab Staff
Manushi Trivedi, PhD student, Cornell University
Manushi studies horticulture biology and is working with Dr. Justine Vanden Heuvel. She has a background in remote sensing and earth observations applications in agriculture. Currently she is developing a nutrient sampling guide for vineyards based on readily available satellite images. As a part of precision viticulture, guided sampling quantifies vineyard nutrient status variability. These techniques lead to sustainable practices and can prevent yield losses by optimizing fertilizer applications.
